ASX200 – LOOKING BACK PRE-COVID

If you ask most people on the street if the share market is higher or lower than before COVID, the chances are they will tell you it’s down, especially after the sell-off we saw earlier in the year.

It’s likely the torrent of grim media over the past two years has caused unrest which tends to inform investment behaviours and outlooks.

It’s an unfortunate truth that ‘Market rallies today’ hardly deliver the same feeling to investors as ‘Markets dive in late session sell off’.

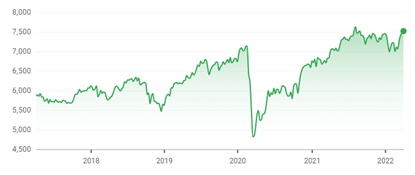
Pre-COVID we were sitting at 7,139 on February 21, 2020 which was at that point the highest historical point in the ASX200 (XJO). As of April 1, 2022, the market was at 7,494 which is 810 points higher than we were.

The below chart shows the ASX200 over a five-year period – if you invested your money back then and closed your eyes since, you’d certainly be glad you made the decision to!

ASX200 Return Chart - 5yr

When it comes to share market returns, it’s important to not only consider the capital growth of the underlying stocks, but also the dividends that most companies also pay.

Investors can track this gross return by using the ASX200 Gross Total Return Index (XJT).

On February 21, 2020 the XJT index was at 77,590 points. On April 1, 2022, the index was tracking at 87,981 which is a huge difference of 10,391.

ASX200 Gross Total Return Chart 5-yr

MORE POSTS...

KATIE ROBINSON BECOMES VISIS PRIVATE CLIENT ADVISER

VISIS team member Katie Robinson has recently moved into the Private Client Adviser role following the successful completion of her professional year and becoming an Authorised Representative of VISIS.

After gaining her bachelor’s degree in property economics, majoring in applied finance and economics, Katie joined the VISIS team a client services officer in 2018.

Read More »